Goal: Practice the model of IoT (Edge) data streaming and its remote analysis (Cloud).
This work was inspired by works of others, in particular [1] and [2].
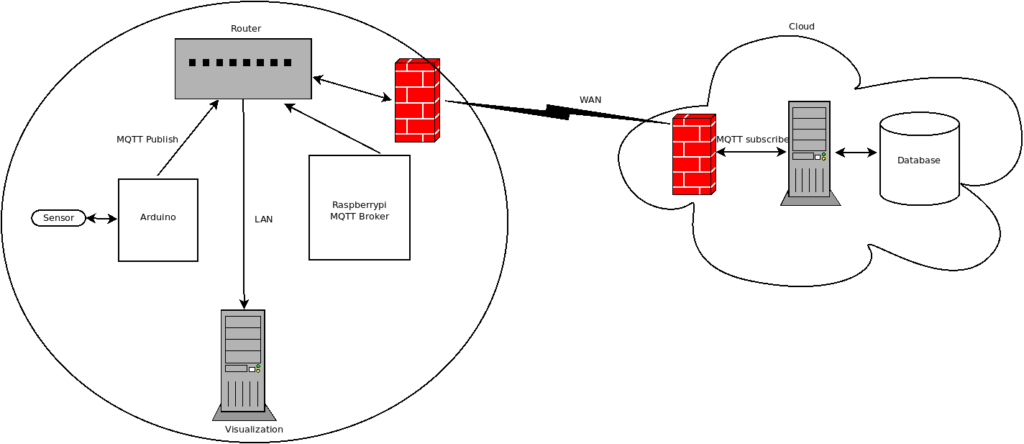
The system schematic diagram is as follows:
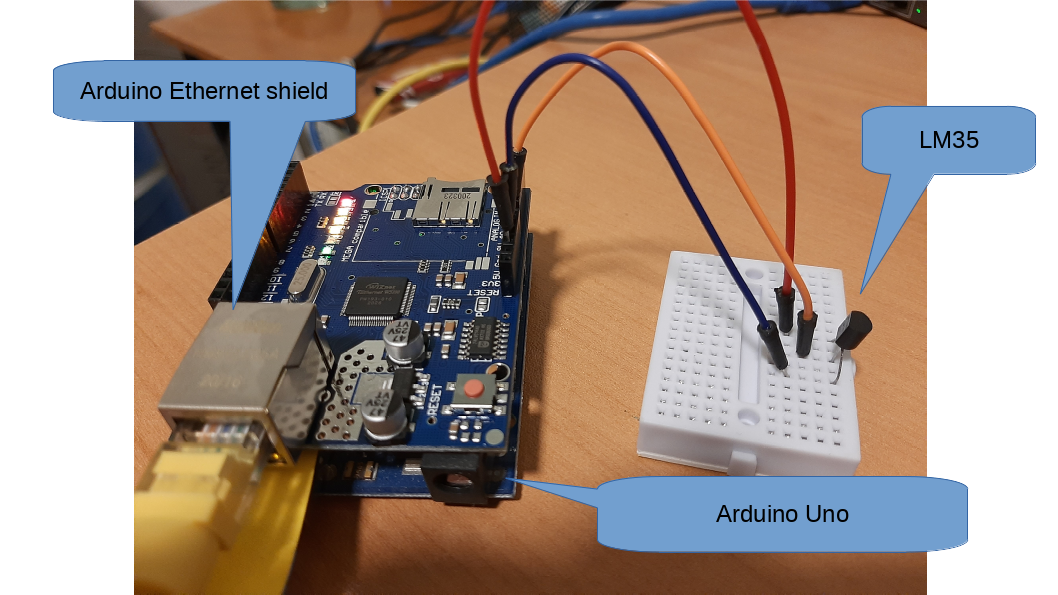
Equipment:
- Arduino Uno.
- Arduino EthernetSheild.
- LM35 temperature sensor (datasheet).
- Raspberrypi-3, serving as an MQTT broker.
- Another computer (my laptop) for visualization.
- Ethernet network to interconnect all the devices (make sure that MQTT port, 1883 by default, is open, “port forwarding”).
Parts can be purchased in many stores including Aliexpress and alike.
Software:
- Data acquisition code for the Arduino is developed, compiled, and uploaded to the device from the Arduino IDE.
- Python code for obtaining the data on the Raspberrypi.
- Influxdb for a database on the Raspberrypi.
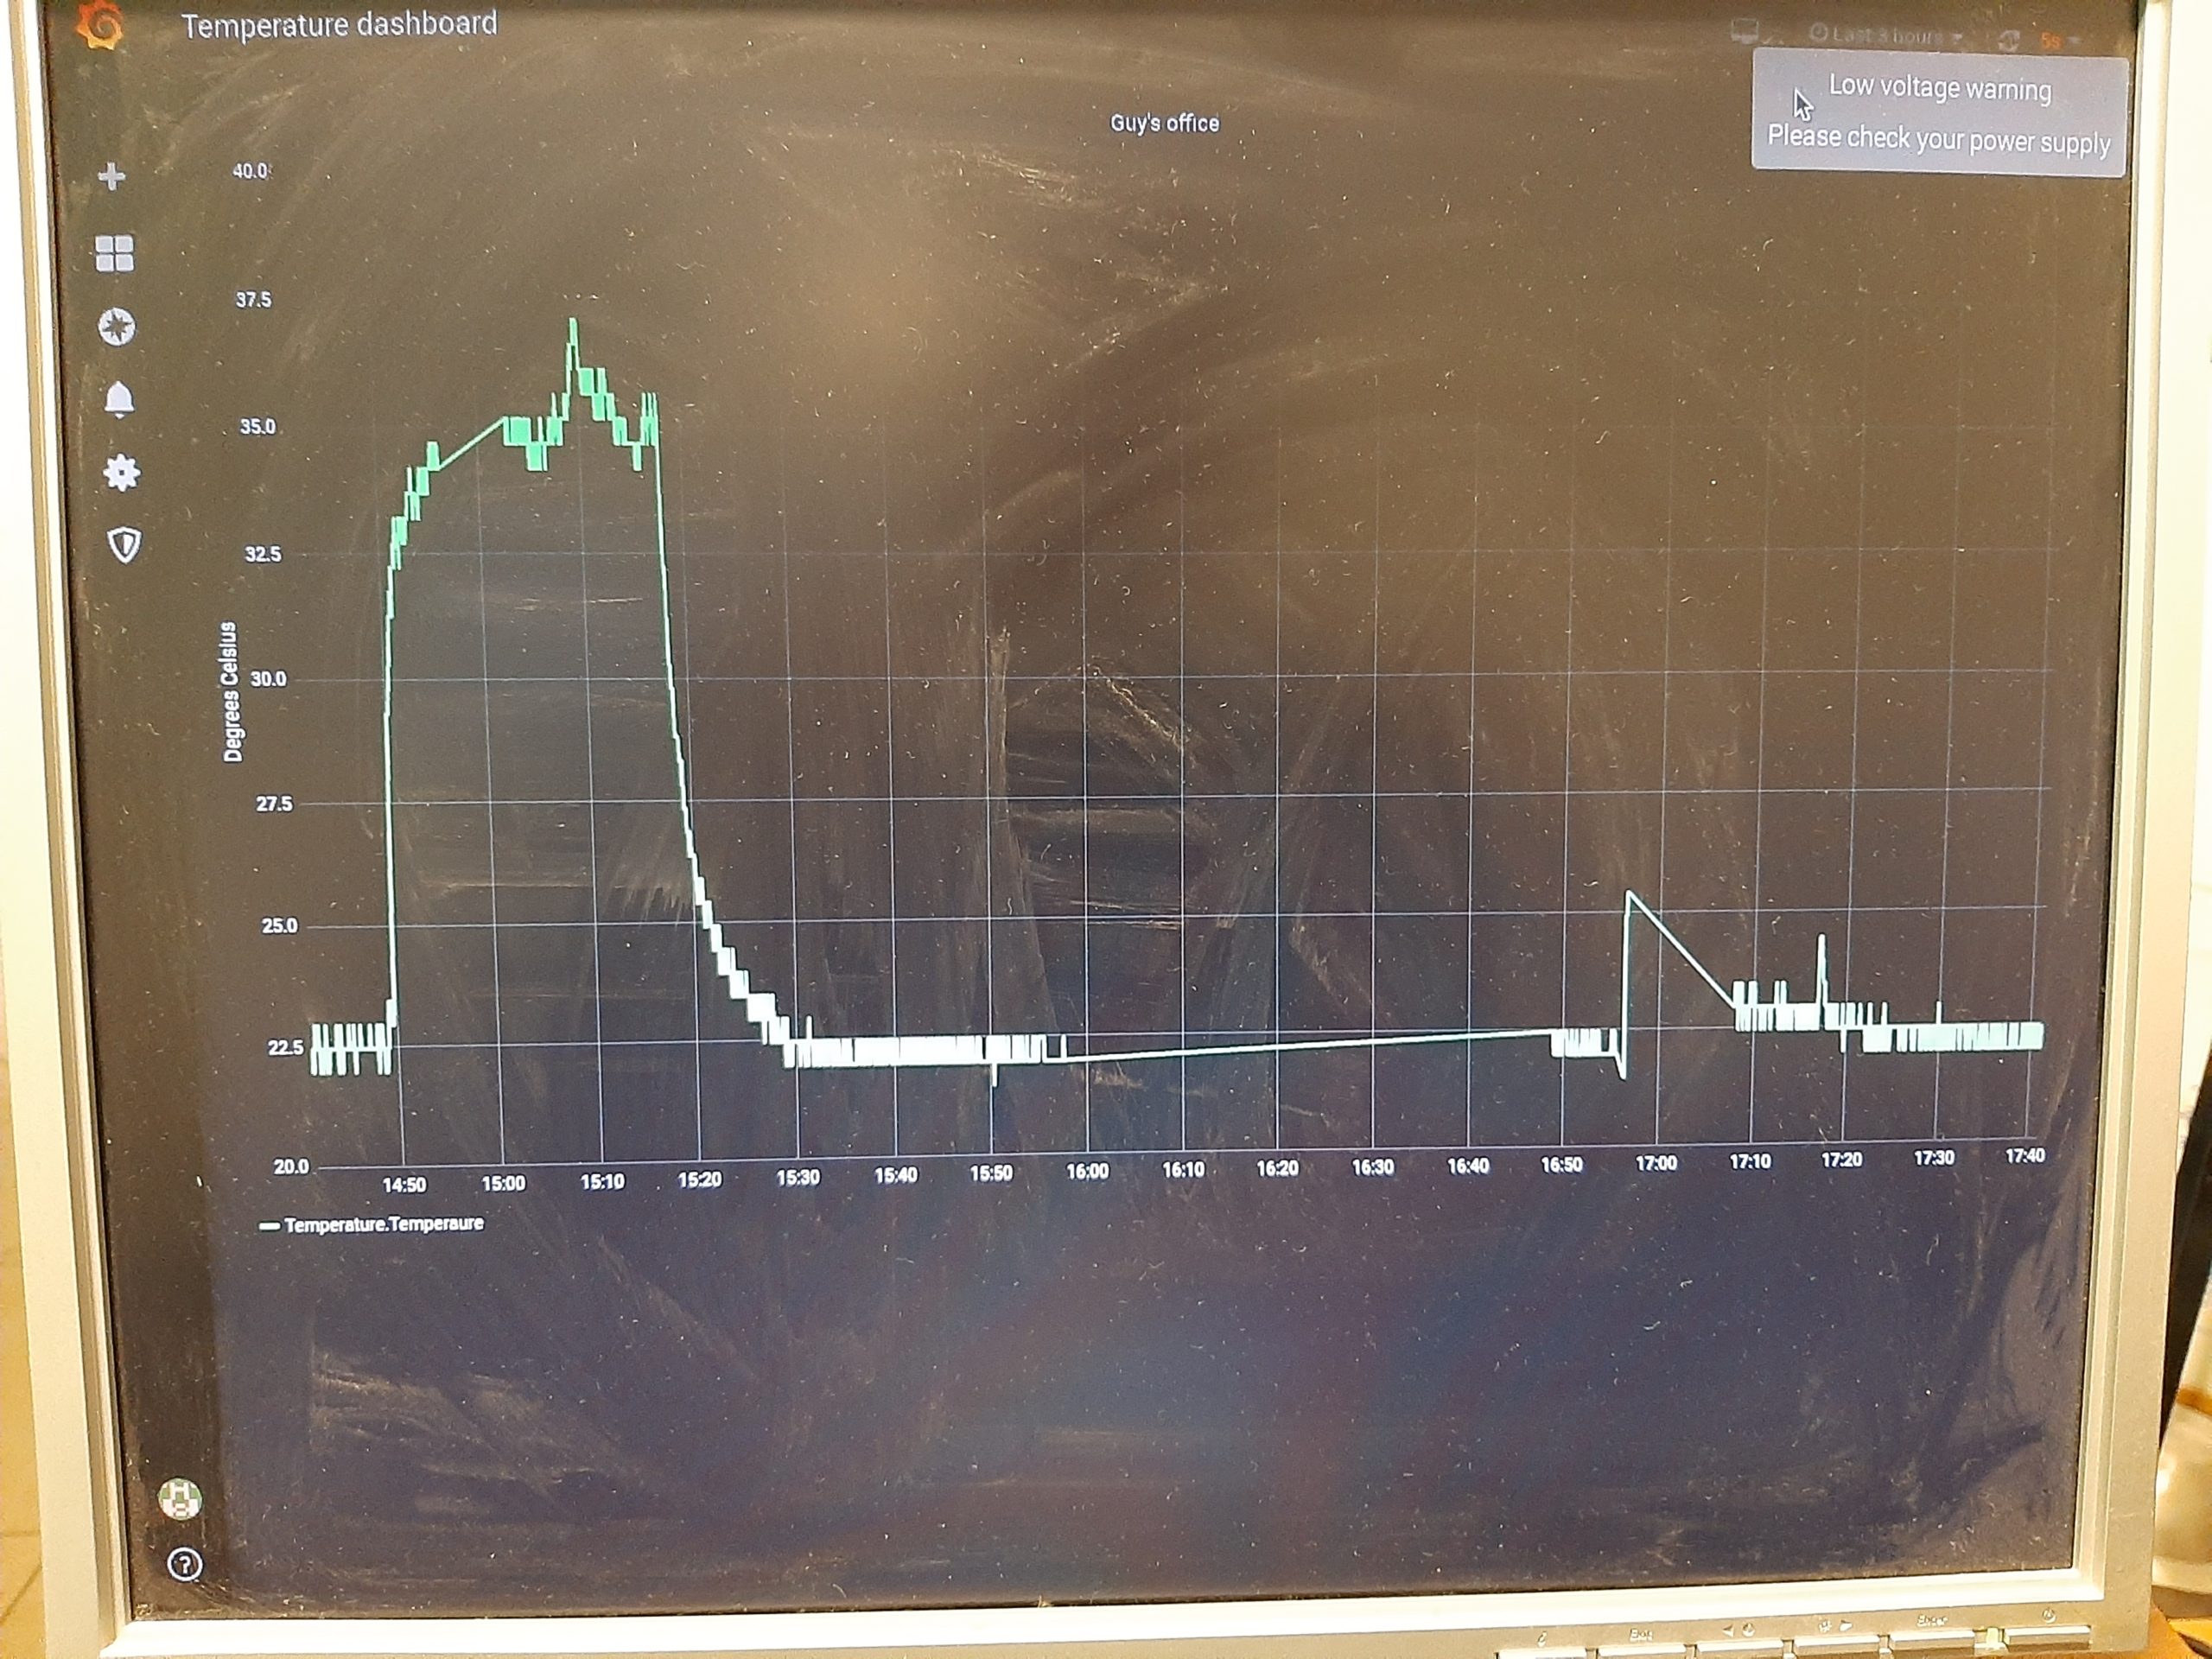
- Grafana for visualization (operated on the Raspebbeypi but also can be installed on another computer as well).
The codes I wrote are not perfect in terms of software quality, efficiency and security! So these code should not be used in any real application and their purpose is for educational use only.
The code is available on my github.
How to learn and understand this project. I would like to suggest a gradual approach:
- First, learn MQTT basics and publish from the device a simple “Hello World” string which can be read (“subscribed”) by another computer on the same network.
- Then, connect the temperature sensor, check that you can correctly read it, and then replace the “Hello World” string with the temperature reading.
- Install the software on the Raspberrypi. You need to know how to create a new Influxdb database and have to master a few SQL elementary commands.
- Install Grafana and connect it with Influxdb using a built-in module.
More ideas to go from here:
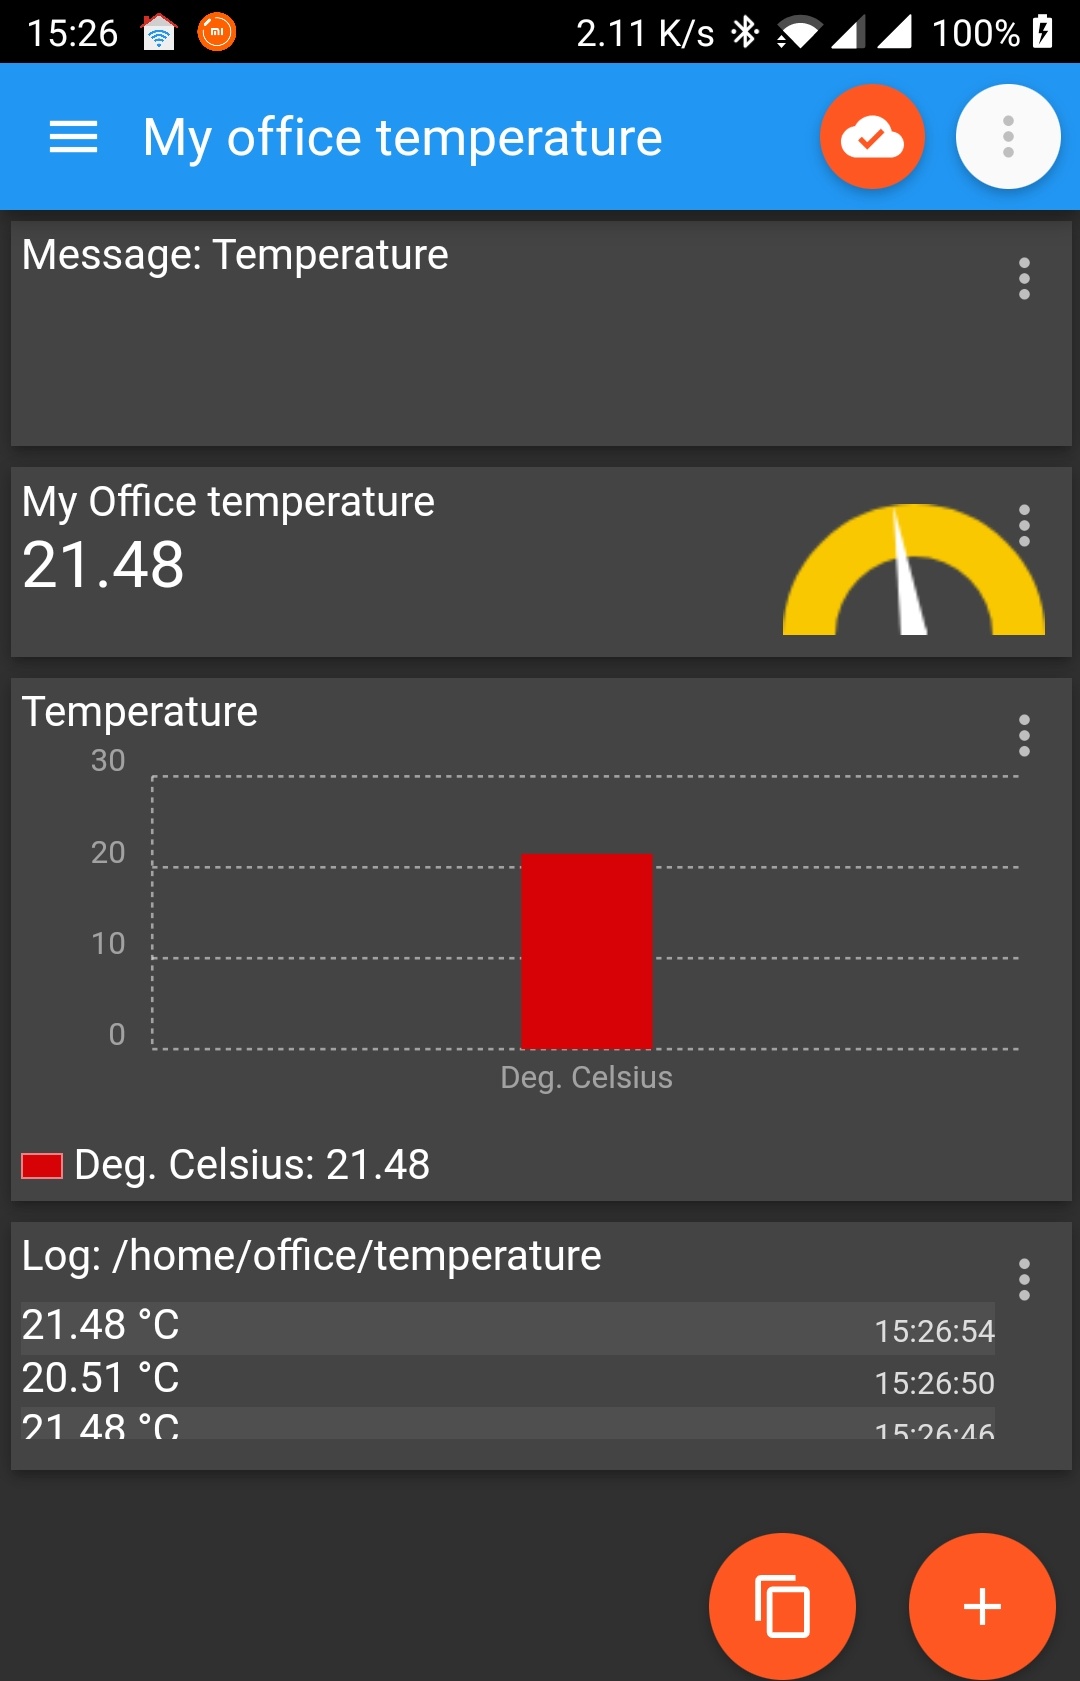
- You can install an MQTT client on your mobile phone and after a short setup you can view the temperature from there:
2) You can upload the temperature reading to the cloud. It makes more sense to install the database on a big machine and not on the Raspberrypi since the data volume is expected to grow with time. In order to be as much as possible vendor-neutral, I decided not to use IoT-ready solutions by the cloud providers and therefore I installed a fresh Ubuntu (“ubuntu-focal-20.04” image) node in the AWS cloud (IaaS). After installing the needed software tools (in a similar way to the Raspberrypi) the node became ready to accept the temperature data: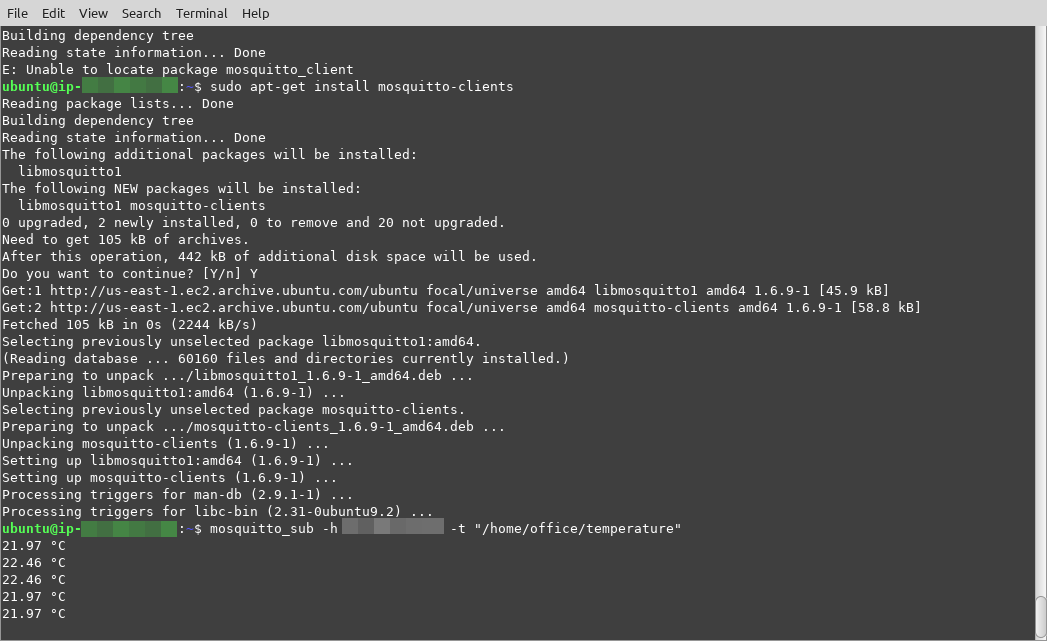
It is then possible to install Grafana on a local computer and to connect it to the Influxdb in the cloud or to install Grafana also on the cloud and then to view it using tools such as VNCserver/client.
References:
[1] Maker.io, “How To Use Basic MQTT on Arduino“.
[2] DiyIOt, “Visualize MQTT Data with InfluxDB and Grafana“.